React mini charts
A few days ago, I published my first npm package: react-mini-charts!
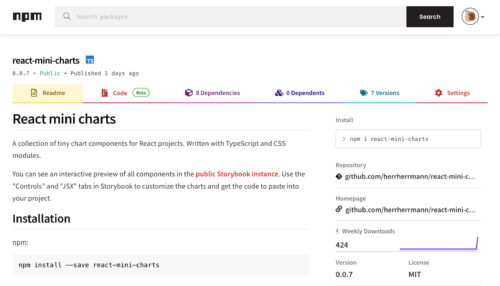
As the name suggests, it’s a small library of chart components for React. So far, there are only two charts available: a simple bar chart with labels and a pie chart (without any labels or legend). The bar chart component is an adapted and cleaned-up version of a component I’ve used for landing pages in the past. It’s basically just a bunch of styled HTML. The pie chart component is brand new and the first SVG-based chart in the library!
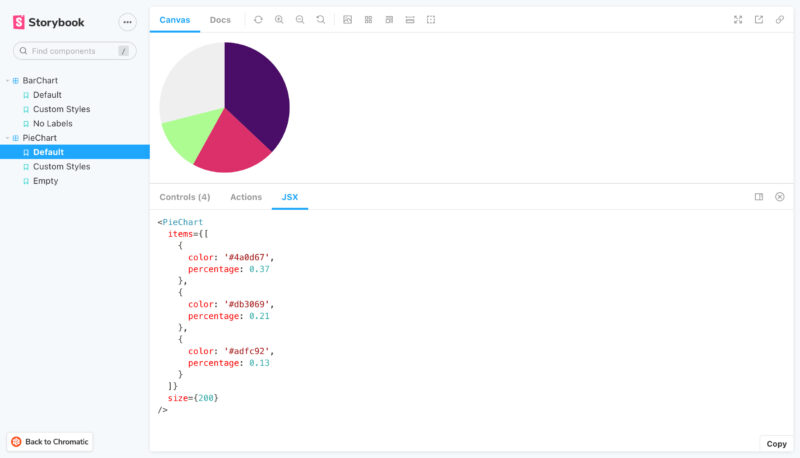
The “JSX” tab shows the code to generate the component.
It took me a few hours to set up the repo how I wanted it, but now it has some cool features:
- There’s a live preview of the library in the shape of a public Storybook instance (deployed via Chromatic). It can be used to browse the different components and props, and it even generates JSX code, ready to be pasted into the target project.
- There’s a suite of tests that runs automatically for every pull request.
- There’s a modern build system based on Rollup, which supports different module formats and tree shaking.
This is just the beginning of react-mini-charts! I don’t expect many peeps to use it, but it’s a great learning environment. And working on it in the open forces me to write good commit messages and documentation.